Clean housing data
In this notebook, we download housing data from a popular MLS website, merge, clean, filter and prepare it for subsequent spatial and statistical analysis.
import pandas as pd
import matplotlib.pyplot as plt

%matplotlib inline
Read data from all CSV files
csv1_path = 'resources/file1_2018-09-20-14-42-11_4k.csv'
csv2_path = 'resources/file2_2018-09-20-15-04-20_g.csv'
csv3_path = 'resources/file3_2018-09-20-16-02-01_b.csv'

prop_df1 = pd.read_csv(csv1_path)
prop_df2 = pd.read_csv(csv2_path)
prop_df3 = pd.read_csv(csv3_path)
prop_df1.head(3)
| SALE TYPE | SOLD DATE | PROPERTY TYPE | ADDRESS | CITY | STATE | ZIP | PRICE | BEDS | BATHS | ... | STATUS | NEXT OPEN HOUSE START TIME | NEXT OPEN HOUSE END TIME | URL (SEE http://www.redfin.com/buy-a-home/comparative-market-analysis FOR INFO ON PRICING) | SOURCE | MLS# | FAVORITE | INTERESTED | LATITUDE | LONGITUDE | |
|---|---|---|---|---|---|---|---|---|---|---|---|---|---|---|---|---|---|---|---|---|---|
| 0 | MLS Listing | NaN | Single Family Residential | 3445 NE Marine Dr Unit BH04 | Portland | OR | 97211.0 | 27500.0 | 0.0 | 1.0 | ... | Active | NaN | NaN | http://www.redfin.com/OR/Portland/3445-NE-Mari... | RMLS | 18567126 | N | Y | 45.600583 | -122.628508 |
| 1 | MLS Listing | NaN | Vacant Land | NW Thurman St | Portland | OR | 97210.0 | 30000.0 | NaN | NaN | ... | Active | NaN | NaN | http://www.redfin.com/OR/Portland/NW-Thurman-S... | RMLS | 18118897 | N | Y | 45.537928 | -122.718082 |
| 2 | MLS Listing | NaN | Vacant Land | NE Rocky Butte Rd | Portland | OR | 97220.0 | 34777.0 | NaN | NaN | ... | Active | NaN | NaN | http://www.redfin.com/OR/Portland/NE-Rocky-But... | RMLS | 18454531 | N | Y | 45.542424 | -122.565746 |
3 rows × 27 columns
(prop_df1.shape, prop_df2.shape, prop_df3.shape)
((3716, 27), (387, 27), (133, 27))
Merge all CSV into a single sheet
prop_df = prop_df1.append(prop_df2)
prop_df = prop_df.append(prop_df3)
prop_df.shape
(4236, 27)
Find if there are duplicates
prop_dup_index = prop_df.duplicated(['MLS#'])
prop_dup = prop_df[prop_dup_index]
prop_dup.shape
(209, 27)
prop_df.drop_duplicates(subset=['MLS#'], inplace=True)
prop_df.shape
(4027, 27)
Clean column names
Column names contain illegal characters. Let us rename them
prop_df.columns
Index(['SALE TYPE', 'SOLD DATE', 'PROPERTY TYPE', 'ADDRESS', 'CITY', 'STATE',
       'ZIP', 'PRICE', 'BEDS', 'BATHS', 'LOCATION', 'SQUARE FEET', 'LOT SIZE',
       'YEAR BUILT', 'DAYS ON MARKET', '$/SQUARE FEET', 'HOA/MONTH', 'STATUS',
       'NEXT OPEN HOUSE START TIME', 'NEXT OPEN HOUSE END TIME',
       'URL (SEE http://www.redfin.com/buy-a-home/comparative-market-analysis FOR INFO ON PRICING)',
       'SOURCE', 'MLS#', 'FAVORITE', 'INTERESTED', 'LATITUDE', 'LONGITUDE'],
      dtype='object')
prop_df.rename(index=str, columns={'$/SQUARE FEET':'PRICE PER SQFT',
                                  'HOA/MONTH':'HOA PER MONTH',
                                  'URL (SEE http://www.redfin.com/buy-a-home/comparative-market-analysis FOR INFO ON PRICING)':'URL',
                                  'MLS#':'MLS'}, inplace=True)
prop_df.columns
Index(['SALE TYPE', 'SOLD DATE', 'PROPERTY TYPE', 'ADDRESS', 'CITY', 'STATE',
       'ZIP', 'PRICE', 'BEDS', 'BATHS', 'LOCATION', 'SQUARE FEET', 'LOT SIZE',
       'YEAR BUILT', 'DAYS ON MARKET', 'PRICE PER SQFT', 'HOA PER MONTH',
       'STATUS', 'NEXT OPEN HOUSE START TIME', 'NEXT OPEN HOUSE END TIME',
       'URL', 'SOURCE', 'MLS', 'FAVORITE', 'INTERESTED', 'LATITUDE',
       'LONGITUDE'],
      dtype='object')
Drop unnecessary columns
While it is beneficial to have a lot of features (columns) in our dataset, it is also important to drop those that are highly correlated to an existing field or a derivative of one or fields that we will never use. In the following, we drop fields that we will never use in this analysis.
prop_df.drop(columns=['SOLD DATE','NEXT OPEN HOUSE START TIME', 'NEXT OPEN HOUSE END TIME',
                     'FAVORITE', 'INTERESTED'], inplace=True)
prop_df.columns
Index(['SALE TYPE', 'PROPERTY TYPE', 'ADDRESS', 'CITY', 'STATE', 'ZIP',
       'PRICE', 'BEDS', 'BATHS', 'LOCATION', 'SQUARE FEET', 'LOT SIZE',
       'YEAR BUILT', 'DAYS ON MARKET', 'PRICE PER SQFT', 'HOA PER MONTH',
       'STATUS', 'URL', 'SOURCE', 'MLS', 'LATITUDE', 'LONGITUDE'],
      dtype='object')
Find and fill missing values
Missing values in certain columns are critical - beds, bath, price, latitude, longitude. We will drop these rows. Missing values in remaining columns are not so critical, we will fill them with 0 or average values.
Before we fill, let us explore the histograms of numerical columns. With pandas, this can be accomplished with a single command as shown below:
# explore distribution of numeric columns
ax_list = prop_df.hist(bins=25, layout=(4,4), figsize=(15,15))
# drop rows with missing values in critical columns
prop_df_nona = prop_df.dropna(axis=0, how='any', # if any of these cols are empty, remove row
                              subset=['BEDS','BATHS', 'PRICE', 'YEAR BUILT', 'LATITUDE','LONGITUDE'])
prop_df_nona.shape
(3653, 22)
Let us impute for missing values using different strategies for different columns.
prop_df_nona['HOA PER MONTH'].fillna(value=0, inplace=True)
prop_df_nona['LOT SIZE'].fillna(value=prop_df_nona['LOT SIZE'].median(), inplace=True)
prop_df_nona['PRICE PER SQFT'].fillna(value=prop_df_nona['PRICE PER SQFT'].median(), inplace=True)
prop_df_nona['SQUARE FEET'].fillna(value=prop_df_nona['SQUARE FEET'].median(), inplace=True)
prop_df_nona['YEAR BUILT'].fillna(value=prop_df_nona['YEAR BUILT'].mode(), inplace=True)
prop_df_nona['ZIP'].fillna(value=prop_df_nona['SQUARE FEET'].mode(), inplace=True)
/Users/atma6951/anaconda3/envs/geosaurus_gold/lib/python3.6/site-packages/pandas/core/generic.py:5434: SettingWithCopyWarning:
A value is trying to be set on a copy of a slice from a DataFrame

See the caveats in the documentation: http://pandas.pydata.org/pandas-docs/stable/indexing.html#indexing-view-versus-copy
  self._update_inplace(new_data)
# explore distribution of numeric columns
ax_list = prop_df_nona.hist(bins=25, layout=(4,4), figsize=(15,15))
Explore distribution of numeric columns
As can be seen from histogram, some numeric columns are heavily sqewed by outliers. Let us pull up statistics for each of these columns
prop_df_nona.describe().round(3)
| ZIP | PRICE | BEDS | BATHS | SQUARE FEET | LOT SIZE | YEAR BUILT | DAYS ON MARKET | PRICE PER SQFT | HOA PER MONTH | LATITUDE | LONGITUDE | |
|---|---|---|---|---|---|---|---|---|---|---|---|---|
| count | 3653.000 | 3653.000 | 3653.000 | 3653.000 | 3653.000 | 3653.000 | 3653.000 | 3653.000 | 3653.000 | 3653.000 | 3653.000 | 3653.000 |
| mean | 97210.091 | 609851.635 | 3.316 | 2.428 | 2291.079 | 13448.155 | 1973.970 | 62.268 | 281.446 | 105.865 | 45.513 | -122.648 |
| std | 93.873 | 458104.003 | 1.762 | 1.340 | 1342.049 | 72390.700 | 36.279 | 72.488 | 118.235 | 223.111 | 0.046 | 0.107 |
| min | 97002.000 | 35000.000 | 0.000 | 0.500 | 212.000 | 25.000 | 1878.000 | 1.000 | 44.000 | 0.000 | 45.382 | -122.902 |
| 25% | 97206.000 | 359900.000 | 2.000 | 2.000 | 1400.000 | 5227.000 | 1948.000 | 15.000 | 206.000 | 0.000 | 45.483 | -122.712 |
| 50% | 97217.000 | 495000.000 | 3.000 | 2.500 | 2062.000 | 6969.000 | 1980.000 | 42.000 | 251.000 | 0.000 | 45.516 | -122.661 |
| 75% | 97229.000 | 699934.000 | 4.000 | 3.000 | 2862.000 | 8712.000 | 2006.000 | 84.000 | 321.000 | 74.000 | 45.541 | -122.584 |
| max | 98664.000 | 8650000.000 | 43.000 | 21.000 | 14500.000 | 3167247.000 | 2019.000 | 1080.000 | 1505.000 | 2091.000 | 45.703 | -122.306 |
Build statistical filters to remove outliers
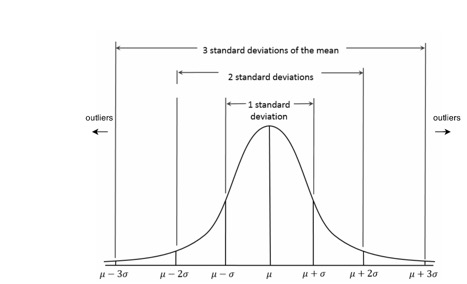
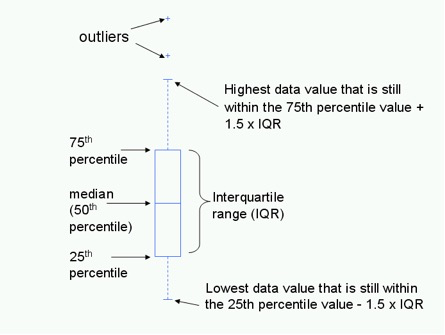
In this segment, we build $6\sigma$ and Inter Quartile Range (IQR) filters to remove outliers from our dataset.
6 sigma filter
 Statistically, about
 99.5% of data falls within $\pm 3 \sigma$ from $\mu$ (mean). Thus, for fairly normally distributed data, $6\sigma$ filter yields a good resultant dataset.
IQR filter
 Howerver, certain columns such as
 BEDS, LOT SIZE are heavily sqewed. For such, the Inter Quartile Range filter (which uses median as a measure of centrality unlike 6sigma which uses mean) yields a robust filter as it is unaffected by outliers like the 6 sigma filter.
def six_sigma_filter(df, column):
    sigma = df[column].std()
    mu = df[column].mean()
    three_sigma = [mu-(3*sigma), mu+(3*sigma)]
    print("Column:{}, Mean:{}, Sigma:{}, 3sigma_range: {}:{}".format(column,mu.round(3),
                                                                       sigma.round(3),
                                                                       three_sigma[0].round(2),
                                                                       three_sigma[1].round(2)))

    # filter
    df_to_keep = df[(df[column] > three_sigma[0]) & (df[column] < three_sigma[1])]

    # prints
    num_rows_dropped = prop_df.shape[0] - df_to_keep.shape[0]
    print("Number of rows dropped: " + str(num_rows_dropped))

    return df_to_keep
def iqr_filter(df, column):
    med = df[column].median()
    p_25 = df[column].quantile(q=0.25)
    p_75 = df[column].quantile(q=0.75)

    # find valid range
    iqr_range = [med-(2*p_25), med+(2*p_75)]
    print("Column: {}, Median:{}, 25%:{}, 75%:{}, IQR:{}:{}".format(column,med,
                                                                    p_25,p_75,
                                                                    iqr_range[0].round(2),
                                                                    iqr_range[1].round(2)))

    # filter
    df_to_keep = df[(df[column] > iqr_range[0]) & (df[column] < iqr_range[1])]

    #prints
    num_rows_dropped = prop_df.shape[0] - df_to_keep.shape[0]
    print("Number of rows dropped: " + str(num_rows_dropped))

    return df_to_keep
Filter columns using both filters and compare
prop_df2 = six_sigma_filter(prop_df_nona, 'BATHS')
Column:BATHS, Mean:2.428, Sigma:1.34, 3sigma_range: -1.59:6.45
Number of rows dropped: 422
prop_df2_iqr = iqr_filter(prop_df_nona, 'BATHS')
Column: BATHS, Median:2.5, 25%:2.0, 75%:3.0, IQR:-1.5:8.5
Number of rows dropped: 396
prop_df4 = six_sigma_filter(prop_df2, 'BEDS')
Column:BEDS, Mean:3.206, Sigma:1.263, 3sigma_range: -0.58:7.0
Number of rows dropped: 459
prop_df4_iqr = iqr_filter(prop_df2_iqr, 'BEDS')
Column: BEDS, Median:3.0, 25%:2.0, 75%:4.0, IQR:-1.0:11.0
Number of rows dropped: 403
(prop_df4.shape, prop_df4_iqr.shape)
((3539, 22), (3624, 22))
ax_list = prop_df4.hist(bins=25, layout=(4,4), figsize=(15,15))
ax_list = prop_df4_iqr.hist(bins=25, layout=(4,4), figsize=(15,15))
Write cleaned, appended table to disk
The IQR filter yields a better result in our case as the resulting histograms of numeric columns show a nice normal distribution. We proceed with this dataset and write that to disk.
prop_df4_iqr.to_csv('resources/houses_for_sale_filtered.csv')