Predicting CA housing prices using SparkMLib
Boiler plate - initialize SparkSession & Context
# Import SparkSession
from pyspark.sql import SparkSession

# Build the SparkSession
spark = SparkSession.builder \
   .master("local") \
   .appName("Linear Regression Model") \
   .config("spark.executor.memory", "1gb") \
   .getOrCreate()

sc = spark.sparkContext
About CA housing dataset
Number of records: 20640
variables: Lat, Long, Median Age, #rooms, #bedrooms, population in block, households, med income, med house value
Preprocess data
!ls ../datasets/CaliforniaHousing/
cal_housing.data cal_housing.domain
# load data file
rdd = sc.textFile('../datasets/CaliforniaHousing/cal_housing.data')

# load header
header = sc.textFile('../datasets/CaliforniaHousing/cal_housing.domain')
len(rdd.collect())
20640
len(rdd.take(5))
5
rdd.take(5)
['-122.230000,37.880000,41.000000,880.000000,129.000000,322.000000,126.000000,8.325200,452600.000000',
 '-122.220000,37.860000,21.000000,7099.000000,1106.000000,2401.000000,1138.000000,8.301400,358500.000000',
 '-122.240000,37.850000,52.000000,1467.000000,190.000000,496.000000,177.000000,7.257400,352100.000000',
 '-122.250000,37.850000,52.000000,1274.000000,235.000000,558.000000,219.000000,5.643100,341300.000000',
 '-122.250000,37.850000,52.000000,1627.000000,280.000000,565.000000,259.000000,3.846200,342200.000000']
# split by comma
rdd = rdd.map(lambda line : line.split(','))

# get the first two lines
rdd.first()
['-122.230000',
 '37.880000',
 '41.000000',
 '880.000000',
 '129.000000',
 '322.000000',
 '126.000000',
 '8.325200',
 '452600.000000']
Convert RDD to Spark DataFrame
# convert RDD to a dataframe
from pyspark.sql import Row

# Map the RDD to a DF
df = rdd.map(lambda line: Row(longitude=line[0],
                              latitude=line[1],
                              housingMedianAge=line[2],
                              totalRooms=line[3],
                              totalBedRooms=line[4],
                              population=line[5],
                              households=line[6],
                              medianIncome=line[7],
                              medianHouseValue=line[8])).toDF()

# show the top few DF rows
df.show(5)
+-----------+----------------+---------+-----------+----------------+------------+-----------+-------------+-----------+
| households|housingMedianAge| latitude|  longitude|medianHouseValue|medianIncome| population|totalBedRooms| totalRooms|
+-----------+----------------+---------+-----------+----------------+------------+-----------+-------------+-----------+
| 126.000000|       41.000000|37.880000|-122.230000|   452600.000000|    8.325200| 322.000000|   129.000000| 880.000000|
|1138.000000|       21.000000|37.860000|-122.220000|   358500.000000|    8.301400|2401.000000|  1106.000000|7099.000000|
| 177.000000|       52.000000|37.850000|-122.240000|   352100.000000|    7.257400| 496.000000|   190.000000|1467.000000|
| 219.000000|       52.000000|37.850000|-122.250000|   341300.000000|    5.643100| 558.000000|   235.000000|1274.000000|
| 259.000000|       52.000000|37.850000|-122.250000|   342200.000000|    3.846200| 565.000000|   280.000000|1627.000000|
+-----------+----------------+---------+-----------+----------------+------------+-----------+-------------+-----------+
only showing top 5 rows
df.printSchema()
root
 |-- households: string (nullable = true)
 |-- housingMedianAge: string (nullable = true)
 |-- latitude: string (nullable = true)
 |-- longitude: string (nullable = true)
 |-- medianHouseValue: string (nullable = true)
 |-- medianIncome: string (nullable = true)
 |-- population: string (nullable = true)
 |-- totalBedRooms: string (nullable = true)
 |-- totalRooms: string (nullable = true)
# convert all strings to float using a User Defined Function

from pyspark.sql.types import *

def cast_columns(df):
    for column in df.columns:
        df = df.withColumn(column, df[column].cast(FloatType()))
    return df

new_df = cast_columns(df)
new_df.show(2)
+----------+----------------+--------+---------+----------------+------------+----------+-------------+----------+
|households|housingMedianAge|latitude|longitude|medianHouseValue|medianIncome|population|totalBedRooms|totalRooms|
+----------+----------------+--------+---------+----------------+------------+----------+-------------+----------+
|     126.0|            41.0|   37.88|  -122.23|        452600.0|      8.3252|     322.0|        129.0|     880.0|
|    1138.0|            21.0|   37.86|  -122.22|        358500.0|      8.3014|    2401.0|       1106.0|    7099.0|
+----------+----------------+--------+---------+----------------+------------+----------+-------------+----------+
only showing top 2 rows
new_df.printSchema()
root
 |-- households: float (nullable = true)
 |-- housingMedianAge: float (nullable = true)
 |-- latitude: float (nullable = true)
 |-- longitude: float (nullable = true)
 |-- medianHouseValue: float (nullable = true)
 |-- medianIncome: float (nullable = true)
 |-- population: float (nullable = true)
 |-- totalBedRooms: float (nullable = true)
 |-- totalRooms: float (nullable = true)
Exploratory data analysis
Print the summary stats of the table
new_df.describe().show()
+-------+-----------------+------------------+-----------------+-------------------+------------------+------------------+------------------+-----------------+------------------+
|summary|       households|  housingMedianAge|         latitude|          longitude|  medianHouseValue|      medianIncome|        population|    totalBedRooms|        totalRooms|
+-------+-----------------+------------------+-----------------+-------------------+------------------+------------------+------------------+-----------------+------------------+
|  count|            20640|             20640|            20640|              20640|             20640|             20640|             20640|            20640|             20640|
|   mean|499.5396802325581|28.639486434108527|35.63186143109965|-119.56970444871473|206855.81690891474|3.8706710030346416|1425.4767441860465|537.8980135658915|2635.7630813953488|
| stddev|382.3297528316098| 12.58555761211163|2.135952380602968|  2.003531742932898|115395.61587441359|1.8998217183639696|  1132.46212176534| 421.247905943133|2181.6152515827944|
|    min|              1.0|               1.0|            32.54|            -124.35|           14999.0|            0.4999|               3.0|              1.0|               2.0|
|    max|           6082.0|              52.0|            41.95|            -114.31|          500001.0|           15.0001|           35682.0|           6445.0|           39320.0|
+-------+-----------------+------------------+-----------------+-------------------+------------------+------------------+------------------+-----------------+------------------+
Feature engineering
Add more columns such as 'number of bedrooms per room', 'rooms per household'. Also scale the 'medianHouseValue' by 1000 so it falls within range of other numbers.
from pyspark.sql.functions import col

df = df.withColumn('medianHouseValue', col('medianHouseValue')/100000)
df.first()
Row(households='126.000000', housingMedianAge='41.000000', latitude='37.880000', longitude='-122.230000', medianHouseValue=4.526, medianIncome='8.325200', population='322.000000', totalBedRooms='129.000000', totalRooms='880.000000')
# add rooms per household
df = df.withColumn('roomsPerHousehold', col('totalRooms')/col('households'))

# add population per household (num people in the home)
df = df.withColumn('popPerHousehold', col('population')/col('households'))

# add bedrooms per room
df = df.withColumn('bedroomsPerRoom', col('totalBedRooms')/col('totalRooms'))
df.first()
Row(households='126.000000', housingMedianAge='41.000000', latitude='37.880000', longitude='-122.230000', medianHouseValue=4.526, medianIncome='8.325200', population='322.000000', totalBedRooms='129.000000', totalRooms='880.000000', roomsPerHousehold=6.984126984126984, popPerHousehold=2.5555555555555554, bedroomsPerRoom=0.14659090909090908)
Re-order columns and split table into label and features
df.columns
['households',
 'housingMedianAge',
 'latitude',
 'longitude',
 'medianHouseValue',
 'medianIncome',
 'population',
 'totalBedRooms',
 'totalRooms',
 'roomsPerHousehold',
 'popPerHousehold',
 'bedroomsPerRoom']
df = df.select('medianHouseValue','households',
 'housingMedianAge',
 'latitude',
 'longitude',
 'medianIncome',
 'population',
 'totalBedRooms',
 'totalRooms',
 'roomsPerHousehold',
 'popPerHousehold',
 'bedroomsPerRoom')
Create a new DataFrame that explicitly labels the columns as labels and features. DenseVector is used to temporarily convert the data into numpy array and regroup into a named column DataFrame
from pyspark.ml.linalg import DenseVector

# return a tuple of first column and all other columns
temp_data = df.rdd.map(lambda x:(x[0], DenseVector(x[1:])))

#construct back a new DataFrame
df2 = spark.createDataFrame(temp_data, ['label','features'])
df2.take(2)
[Row(label=4.526, features=DenseVector([126.0, 41.0, 37.88, -122.23, 8.3252, 322.0, 129.0, 880.0, 6.9841, 2.5556, 0.1466])),
 Row(label=3.585, features=DenseVector([1138.0, 21.0, 37.86, -122.22, 8.3014, 2401.0, 1106.0, 7099.0, 6.2381, 2.1098, 0.1558]))]
Scale data by shifting mean to 0 and making SD = 1
This ensures all columns have similar levels of variability
# use StandardScaler to scale the features to std normal distribution
from pyspark.ml.feature import StandardScaler

s_scaler_model = StandardScaler(inputCol='features', outputCol='features_scaled')
scaler_fn = s_scaler_model.fit(df2)
scaled_df = scaler_fn.transform(df2)

scaled_df.take(2)
[Row(label=4.526, features=DenseVector([126.0, 41.0, 37.88, -122.23, 8.3252, 322.0, 129.0, 880.0, 6.9841, 2.5556, 0.1466]), features_scaled=DenseVector([0.3296, 3.2577, 17.7345, -61.0073, 4.3821, 0.2843, 0.3062, 0.4034, 2.8228, 0.2461, 2.5264])),
 Row(label=3.585, features=DenseVector([1138.0, 21.0, 37.86, -122.22, 8.3014, 2401.0, 1106.0, 7099.0, 6.2381, 2.1098, 0.1558]), features_scaled=DenseVector([2.9765, 1.6686, 17.7251, -61.0023, 4.3696, 2.1202, 2.6255, 3.254, 2.5213, 0.2031, 2.6851]))]
Split data into training and test sets
train_data, test_data = scaled_df.randomSplit([.8,.2], seed=101)
type(train_data)
pyspark.sql.dataframe.DataFrame
Perform Multiple Regression
Train the model
from pyspark.ml.regression import LinearRegression

lr = LinearRegression(labelCol='label', maxIter=20)

linear_model = lr.fit(train_data)
Inspect model properties
type(linear_model)
pyspark.ml.regression.LinearRegressionModel
linear_model.coefficients
DenseVector([0.0011, 0.0109, -0.4173, -0.4236, 0.4188, -0.0005, 0.0001, 0.0, 0.0275, 0.0012, 3.2844])
Print columns and their coefficients
list(zip(df.columns[1:], linear_model.coefficients))
[('households', 0.0011435392550412861),
 ('housingMedianAge', 0.010914556934928758),
 ('latitude', -0.41728655702892636),
 ('longitude', -0.42357898833074664),
 ('medianIncome', 0.41879550542755656),
 ('population', -0.00047200983464106163),
 ('totalBedRooms', 0.00011060741530102377),
 ('totalRooms', 4.099208155268924e-05),
 ('roomsPerHousehold', 0.027483252262545631),
 ('popPerHousehold', 0.0011993665224223444),
 ('bedroomsPerRoom', 3.2844476401153044)]
linear_model.intercept
-36.56273436779799
linear_model.summary.numInstances
16535
MAE from training data
linear_model.summary.meanAbsoluteError * 100000
49805.60256405839
Thus, MAE on training data is off by $50,000
linear_model.summary.meanSquaredError
0.46775402314782377
linear_model.summary.rootMeanSquaredError * 100000
68392.54514549255
Thus, RMSE shows fitting on training data is off by $68,392
list(zip(df.columns[1:], linear_model.summary.pValues))
[('households', 0.0),
 ('housingMedianAge', 0.0),
 ('latitude', 0.0),
 ('longitude', 0.0),
 ('medianIncome', 0.0),
 ('population', 0.0),
 ('totalBedRooms', 0.2242631044109853),
 ('totalRooms', 0.00010585023878628697),
 ('roomsPerHousehold', 0.0),
 ('popPerHousehold', 0.011952235555041435),
 ('bedroomsPerRoom', 0.0)]
Perform predictions
predicted = linear_model.transform(test_data)
predicted.columns
['label', 'features', 'features_scaled', 'prediction']
type(predicted)
pyspark.sql.dataframe.DataFrame
test_predictions = predicted.select('prediction').rdd.map(lambda x:x[0])
test_labels = predicted.select('label').rdd.map(lambda x:x[0])

test_predictions_labels = test_predictions.zip(test_labels)
test_predictions_labels_df = spark.createDataFrame(test_predictions_labels,
                                                   ['predictions','labels'])

test_predictions_labels_df.take(2)
[Row(predictions=1.8357791571765532, labels=0.225),
 Row(predictions=-0.9555783395577535, labels=0.225)]
Regression evaluator
from pyspark.ml.evaluation import RegressionEvaluator

linear_reg_eval = RegressionEvaluator(predictionCol='predictions', labelCol='labels')
linear_reg_eval.evaluate(test_predictions_labels_df)
0.6962295496358668
Errors - MAE, RMSE
# mean absolute error
prediction_mae = linear_reg_eval.evaluate(test_predictions_labels_df,
                                          {linear_reg_eval.metricName:'mae'}) * 100000
prediction_mae
49690.440586665725
# RMSE
prediction_rmse = linear_reg_eval.evaluate(test_predictions_labels_df,
                                           {linear_reg_eval.metricName:'rmse'}) * 100000

prediction_rmse
69622.95496358669
Compare training vs prediction errors
print('(training error, prediction error)')
print((linear_model.summary.rootMeanSquaredError * 100000, prediction_rmse))
print((linear_model.summary.meanAbsoluteError * 100000, prediction_mae))
(training error, prediction error)
(68392.54514549255, 69622.95496358669)
(49805.60256405839, 49690.440586665725)
Export data as a Pandas DataFrame
predicted_pandas_df = predicted.select('features','prediction').toPandas()
predicted_pandas_df.head()
| features | prediction | |
|---|---|---|
| 0 | [63.0, 33.0, 37.93, -122.32, 2.675, 216.0, 73.... | 1.835779 |
| 1 | [1439.0, 8.0, 35.43, -116.57, 2.7138, 6835.0, ... | -0.955578 |
| 2 | [15.0, 17.0, 33.92, -114.67, 1.2656, 29.0, 24.... | -0.426930 |
| 3 | [288.0, 20.0, 38.56, -121.36, 1.8288, 667.0, 3... | 0.843599 |
| 4 | [382.0, 52.0, 37.78, -122.41, 1.8519, 1055.0, ... | 2.335877 |
predicted_pandas_df.columns
Index(['features', 'prediction'], dtype='object')
import pandas as pd
predicted_pandas_df2 = pd.DataFrame(predicted_pandas_df['features'].values.tolist(),
                                   columns=df.columns[1:])

predicted_pandas_df2.head()
| households | housingMedianAge | latitude | longitude | medianIncome | population | totalBedRooms | totalRooms | roomsPerHousehold | popPerHousehold | bedroomsPerRoom | |
|---|---|---|---|---|---|---|---|---|---|---|---|
| 0 | 63.0 | 33.0 | 37.93 | -122.32 | 2.6750 | 216.0 | 73.0 | 296.0 | 4.698413 | 3.428571 | 0.246622 |
| 1 | 1439.0 | 8.0 | 35.43 | -116.57 | 2.7138 | 6835.0 | 1743.0 | 9975.0 | 6.931897 | 4.749826 | 0.174737 |
| 2 | 15.0 | 17.0 | 33.92 | -114.67 | 1.2656 | 29.0 | 24.0 | 97.0 | 6.466667 | 1.933333 | 0.247423 |
| 3 | 288.0 | 20.0 | 38.56 | -121.36 | 1.8288 | 667.0 | 332.0 | 1232.0 | 4.277778 | 2.315972 | 0.269481 |
| 4 | 382.0 | 52.0 | 37.78 | -122.41 | 1.8519 | 1055.0 | 422.0 | 1014.0 | 2.654450 | 2.761780 | 0.416174 |
predicted_pandas_df2['predictedHouseValue'] = predicted_pandas_df['prediction']
Write to disk as CSV
predicted_pandas_df2.to_csv('CA_house_prices_predicted.csv')
!ls
CA_house_prices_predicted.csv  spark_sanity.ipynb
ensure_machine.ipynb	       spark-warehouse
hello-world.ipynb	       Untitled.ipynb
spark-ml-CA-housing.ipynb      using-spark-dataframes.ipynb
predicted_pandas_df2.shape
(4105, 12)
Publish to GIS
import pandas as pd
from arcgis.gis import GIS
gis = GIS("https://www.arcgis.com","arcgis_python")
Enter password: ········
from arcgis.features import SpatialDataFrame
sdf = SpatialDataFrame.from_csv('CA_house_prices_predicted.csv')
sdf.head(5)
| households | housingMedianAge | latitude | longitude | medianIncome | population | totalBedRooms | totalRooms | roomsPerHousehold | popPerHousehold | bedroomsPerRoom | predictedHouseValue | |
|---|---|---|---|---|---|---|---|---|---|---|---|---|
| 0 | 63.0 | 33.0 | 37.93 | -122.32 | 2.6750 | 216.0 | 73.0 | 296.0 | 4.698413 | 3.428571 | 0.246622 | 1.835779 |
| 1 | 1439.0 | 8.0 | 35.43 | -116.57 | 2.7138 | 6835.0 | 1743.0 | 9975.0 | 6.931897 | 4.749826 | 0.174737 | -0.955578 |
| 2 | 15.0 | 17.0 | 33.92 | -114.67 | 1.2656 | 29.0 | 24.0 | 97.0 | 6.466667 | 1.933333 | 0.247423 | -0.426930 |
| 3 | 288.0 | 20.0 | 38.56 | -121.36 | 1.8288 | 667.0 | 332.0 | 1232.0 | 4.277778 | 2.315972 | 0.269481 | 0.843599 |
| 4 | 382.0 | 52.0 | 37.78 | -122.41 | 1.8519 | 1055.0 | 422.0 | 1014.0 | 2.654450 | 2.761780 | 0.416174 | 2.335877 |
houses_predicted_fc = gis.content.import_data(sdf[:999])
houses_predicted_fc
<FeatureCollection>
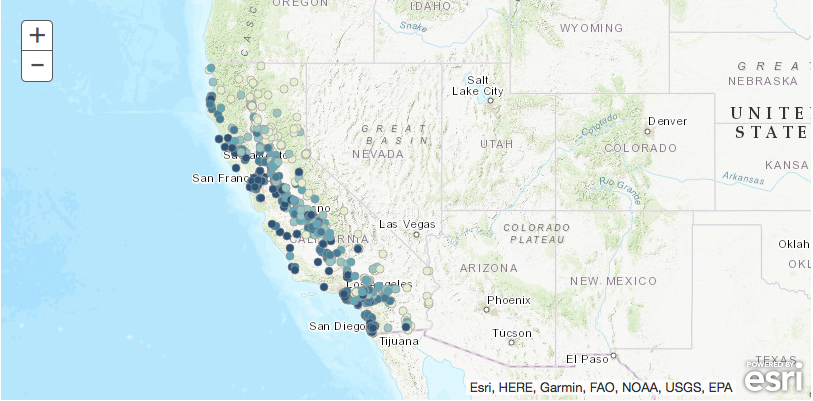
ca_map = gis.map('California')
ca_map

ca_map.add_layer(houses_predicted_fc, {'renderer':'ClassedColorRenderer',
                                      'field_name':'predictedHouseValue'})
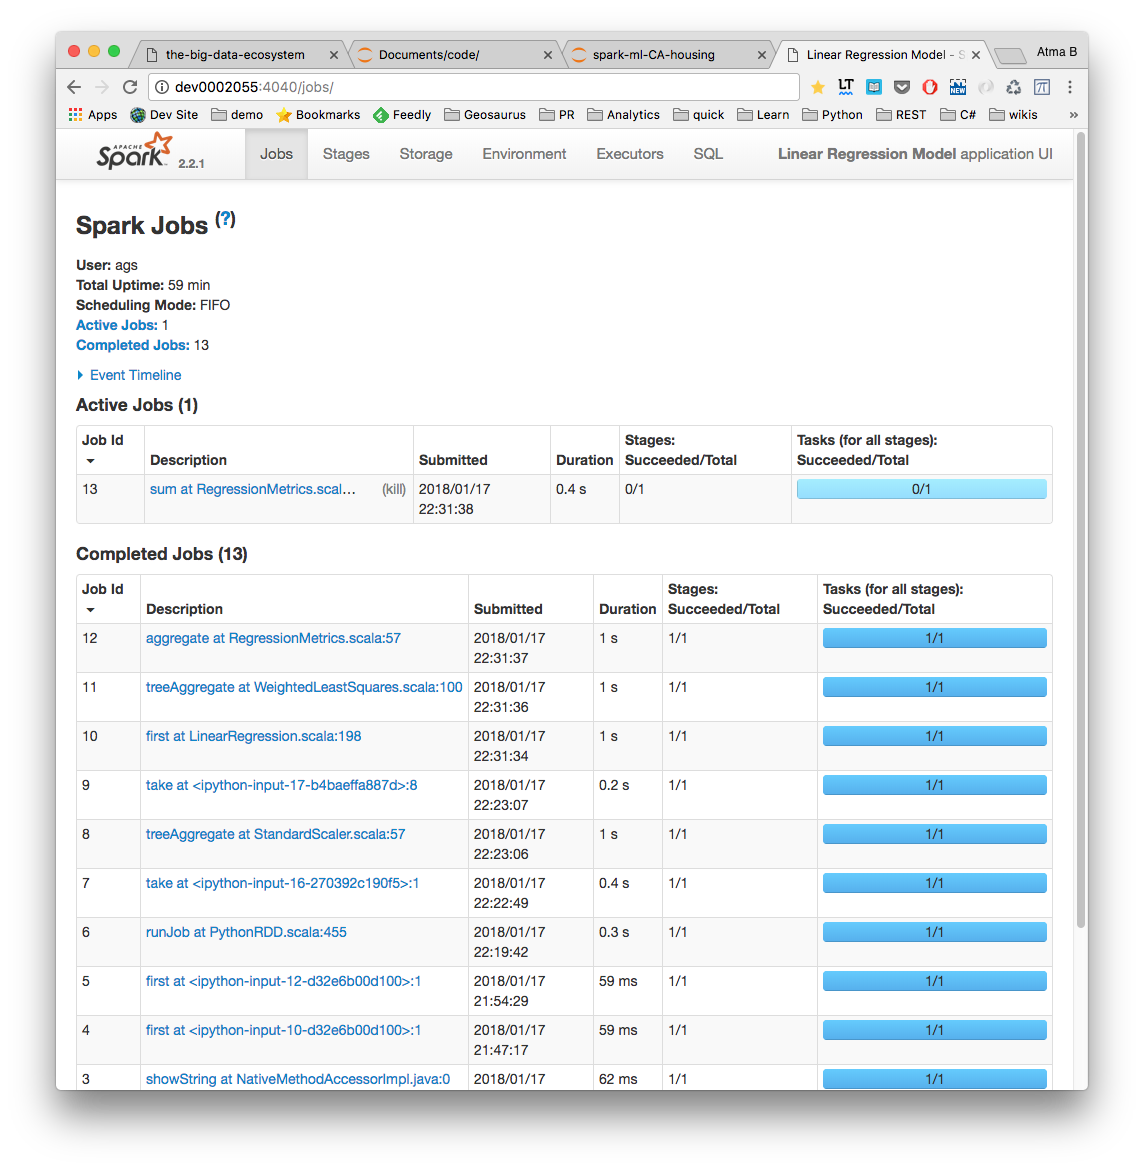
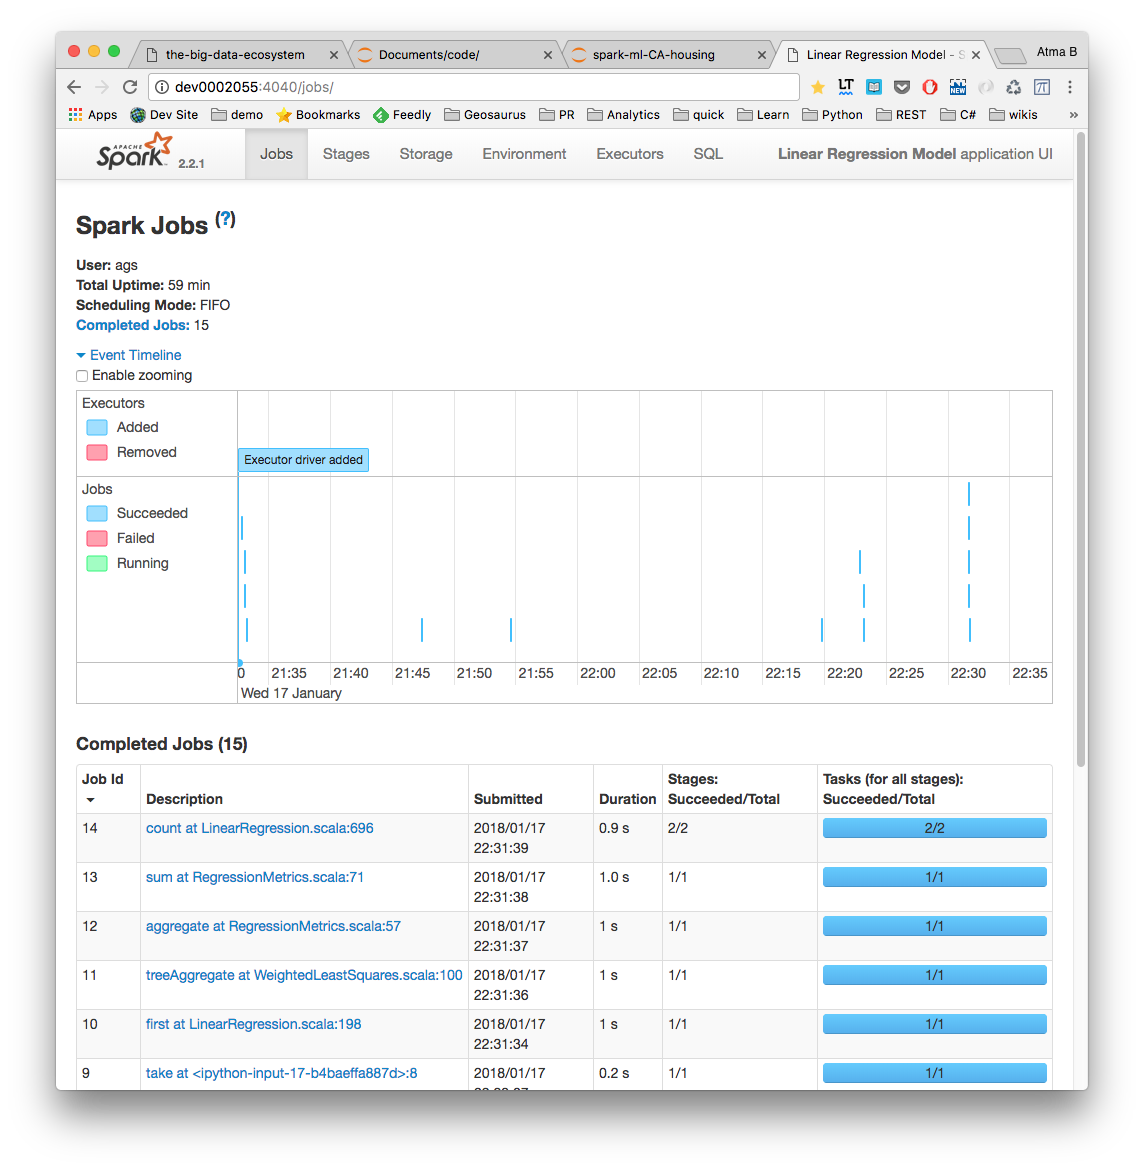
Spark jobs

